Why AI Rollouts Stall: What the Research Says About AI Change Management
Workers who don't use AI are mostly blocked, not sceptical. A review of the peer-reviewed evidence, a 10,000-run rollout simulation, and a 90-day AI change playbook.

Research paper · Evidence-graded · Original simulation included. Reading time: about 18 minutes. The abstract and key findings take under two minutes.
Abstract
Most organizations roll out generative AI the way they roll out software: buy licences, send an announcement, wait for results. The research suggests this is the wrong model. The best field evidence shows that AI raises output for some workers on some tasks, lowers accuracy on others, and delivers its gains through adoption, which is a social and organizational process rather than a technical one. Survey evidence linked to administrative records shows that workers who don't use AI are held back mainly by employer restrictions and a perceived need for training, not by doubts about the tool. Telling them the tool is useful barely changes their behaviour.
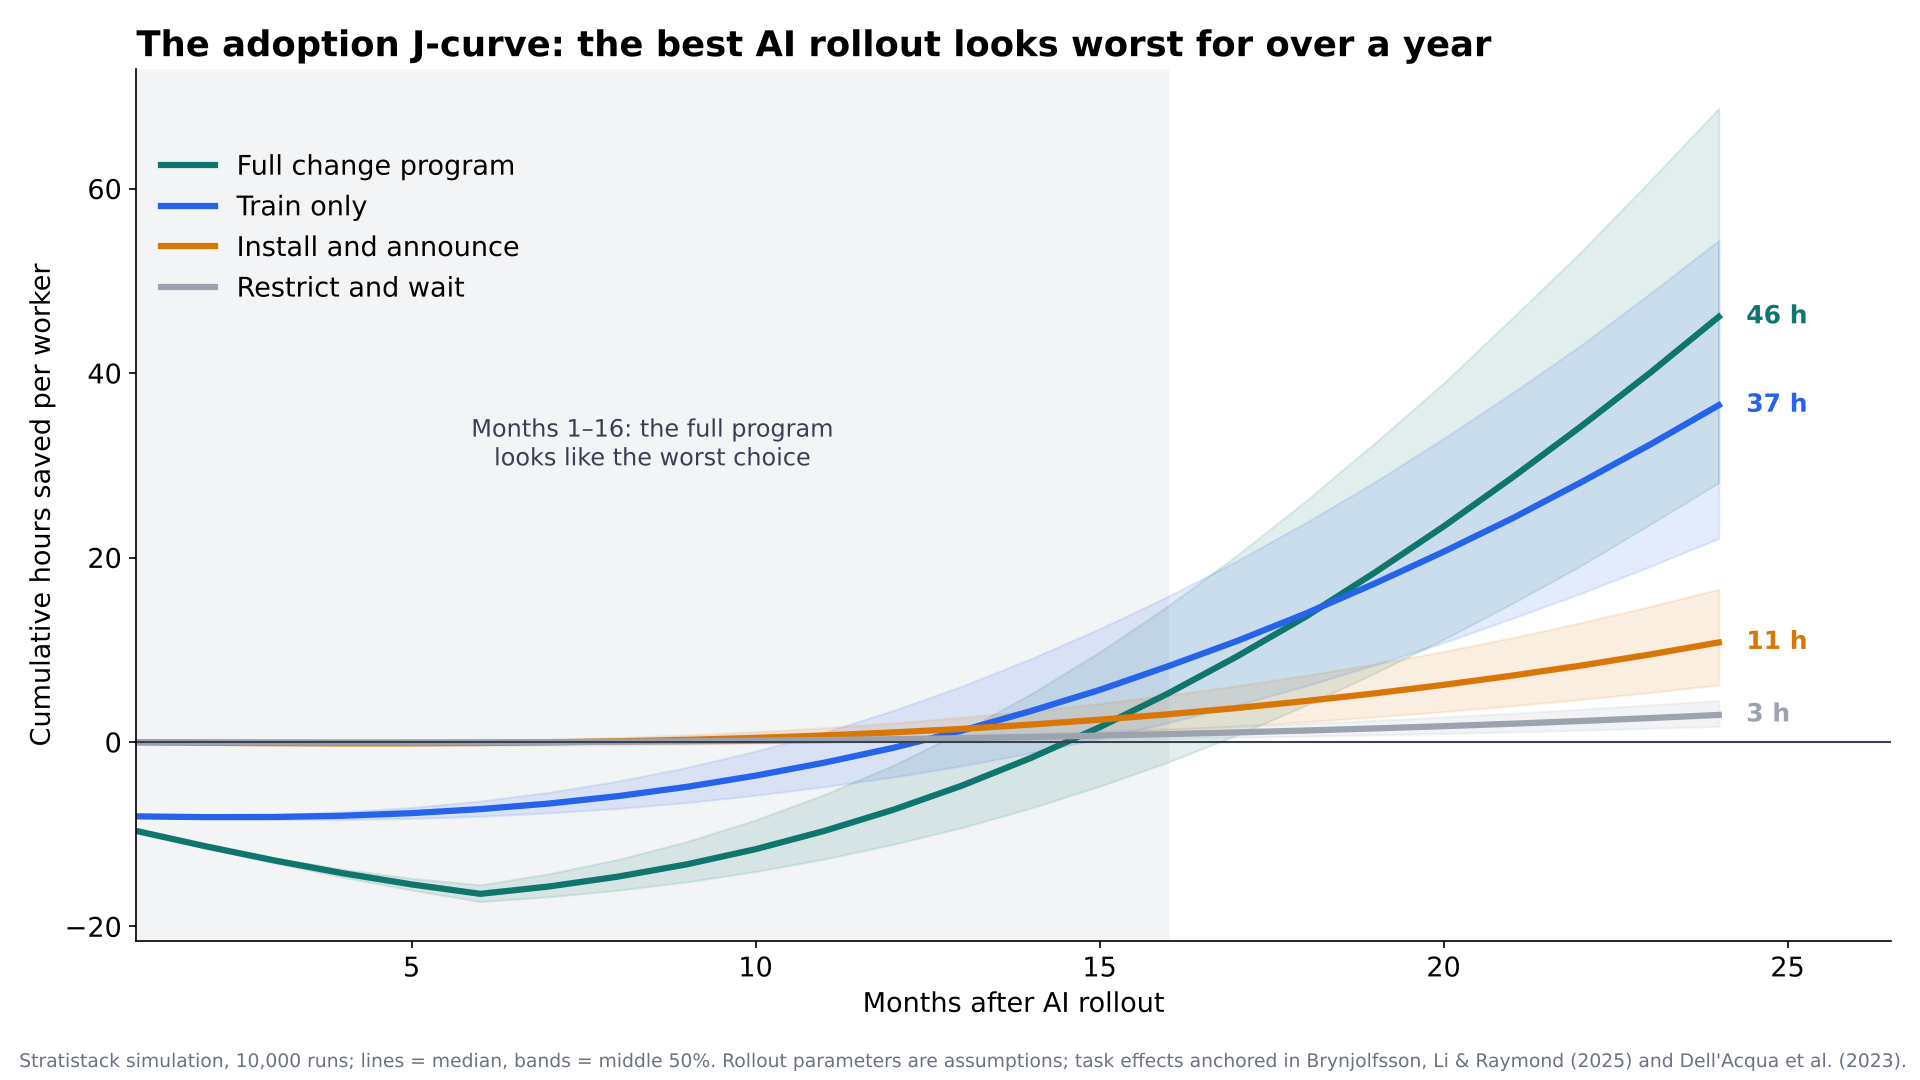
This paper reviews that evidence, grades its strength, and tests it with an original simulation that combines a classic technology-diffusion model with task-level effects from published experiments. Across 10,000 simulated rollouts of the same AI tool, a full change program (training, internal champions, a map of where AI helps and where it misleads, and verification rules) saved a median of 46 hours per worker over two years. Installing the tool and announcing it saved 11. But the full program looked like the worst option for more than a year, because its costs come first and its gains compound later. Leaders who judge an AI rollout at the six-month mark are likely to cancel the strategy that would have paid best.
Key findings
- The tool is not the bottleneck. In a Danish study of 18,000 workers, people saw real productivity potential in ChatGPT but were held back by employer restrictions and a perceived need for training (Humlum & Vestergaard, 2025a). Evidence grade: strong observational, peer-reviewed.
- Information alone doesn't move people. Showing workers expert estimates of AI's time savings changed what they believed, but had limited effect on whether they actually used it (Humlum & Vestergaard, 2024). Grade: randomized information experiment, discussion paper.
- AI's effect depends on the task. Consultants using GPT-4 were faster and better on tasks inside the AI's capability, but 19 percentage points less likely to get the right answer on a task outside it (Dell'Acqua et al., 2023). Grade: pre-registered experiment, working paper.
- Average gains so far are small. Workers report time savings of roughly 1.4% to 2.8% of work hours (Bick et al., 2024; Humlum & Vestergaard, 2025b). Grade: large surveys, working papers.
- Our simulation (analysis, not fact): adoption speed was the lever that mattered most, worth about six times more than faster learning and about nine times more than reducing misuse. The best strategy was behind for more than a year before it pulled ahead.
1. A rollout is not an adoption
When a company "rolls out" AI, it usually means everyone now has access. Access is easy to measure, so it becomes the milestone. Use is harder to see, and value is harder still.
The gap between the three shows up clearly in the data. A nationally representative U.S. survey found that by late 2024, 45% of Americans aged 18 to 64 used generative AI, and 27% of employed people had used it for work in the previous week. Yet respondents reported time savings equal to only 1.4% of total work hours, and the authors note that firm climate and policies play an important role in who adopts (Bick, Blandin & Deming, 2024). In Denmark, where researchers linked surveys of 25,000 workers to employer-employee records, most employers encouraged AI use and training was common, yet average reported time savings were 2.8% of work hours, and the authors could rule out effects on earnings or recorded hours larger than 1% (Humlum & Vestergaard, 2025b).
That is a long way from the 14% to 40% gains in the headlines. The rest of this paper asks why, and what an organization can do about it.
2. What the evidence shows
Each study below gets an evidence grade. Grades describe the study design, not whether the finding is right.
2.1 AI helps most where workers are least experienced
The strongest real-workplace study followed 5,172 customer-support agents at a Fortune 500 software firm as a generative AI assistant was introduced to different groups at different times. Access raised issues resolved per hour by 15% on average in the published version (14% in the earlier working paper). Less experienced and lower-skilled agents improved in both speed and quality, while the most experienced agents saw small speed gains and small declines in quality. Customers were also more polite and less likely to ask for a manager (Brynjolfsson, Li & Raymond, 2025). The working-paper version reported a 34% gain for novice and low-skilled workers.
Evidence grade: strong. Peer-reviewed (Quarterly Journal of Economics). A staggered rollout gives quasi-experimental comparison groups, though it is one firm in one occupation.
Why it matters for change management: the AI worked partly by passing on the habits of the best agents to newer ones. That makes it a learning intervention as much as a productivity tool, and learning depends on how people are supported, not just on access.
2.2 The "jagged frontier": AI can make good people confidently wrong
In a pre-registered experiment with 758 Boston Consulting Group consultants, about 7% of the firm's individual contributors, people given GPT-4 completed 12.2% more tasks, worked 25.1% faster and produced work rated more than 40% higher in quality on 18 tasks inside the AI's capability. On a task deliberately chosen to fall outside it, consultants using AI were 19 percentage points less likely to reach the correct answer (Dell'Acqua et al., 2023). The authors call this uneven boundary the jagged technological frontier: tasks that look equally hard to a person can sit on different sides of it.
Evidence grade: strong design (pre-registered randomized experiment), but a working paper, and the tasks were realistic consulting tasks set for the experiment rather than live client work.
Why it matters: a rollout that only pushes usage up will also push misuse up. People need to know which side of the frontier their tasks sit on, and they need a habit of checking output where the stakes are high.
2.3 Many non-users aren't sceptics. They're blocked
Humlum and Vestergaard surveyed 18,000 workers across 11 AI-exposed occupations in Denmark and linked the answers to government register data. Use was widespread, especially among younger and less experienced workers. Women were 16 percentage points less likely to have used ChatGPT for work. Workers saw substantial productivity potential, but were often held back by employer restrictions and a perceived need for training (Humlum & Vestergaard, 2025a).
The same research included an experiment. A random group of workers was shown expert estimates of how much time ChatGPT could save in their job. Their beliefs and intentions shifted, but their actual adoption changed little (Humlum & Vestergaard, 2024).
A later study by the same authors, covering 25,000 workers and 7,000 workplaces, found that firm-led investments such as encouragement, in-house models and training raised adoption, narrowed demographic gaps in who used the tools, and created new job tasks (Humlum & Vestergaard, 2025b).
Evidence grade: the 2025a adoption paper is peer-reviewed (PNAS); the information experiment and the 2025b labour-market paper are working papers. Both rely partly on self-reported use and time savings.
Why it matters: this is the clearest evidence that adoption is an organizational problem. The barriers workers name are ones management controls: permission and training.
2.4 The J-curve: productivity often dips before it rises
General-purpose technologies such as AI need large complementary investments: new processes, new skills, redesigned jobs. Brynjolfsson, Rock and Syverson (2021) show that because these investments are mostly intangible and poorly measured, productivity looks weak in the early years of a new technology and stronger later, when the benefits are harvested. Adjusting U.S. data for intangibles tied to computer hardware and software, they estimate total factor productivity was 15.9% higher by the end of 2017 than official figures showed. They call this the Productivity J-curve.
Evidence grade: strong. Peer-reviewed (American Economic Journal: Macroeconomics). It is a national-accounts finding, so applying it to a single team is an analogy, which Section 4 tests.
2.5 The counterweight: gains may stay modest
Not everyone expects large effects. Acemoglu (2025) combines task-level estimates of AI exposure and cost savings in a macroeconomic model and finds total factor productivity gains of no more than 0.66% over ten years. It is a peer-reviewed reason to doubt that any rollout strategy will produce dramatic aggregate numbers soon.
Evidence grade: model-based, peer-reviewed (Economic Policy).
3. A myth to retire: "70% of change programs fail"
The claim that 70% of change initiatives fail is widely repeated. It is not well supported.
Mark Hughes reviewed five separate published sources of the 70% figure in the Journal of Change Management. He concluded that while the popular narrative clearly exists, there is no valid and reliable empirical evidence to support it (Hughes, 2011). Note: only the paper's abstract was read for this post.
This matters for AI rollouts in a practical way. A made-up failure rate tells you nothing about why programs fail or what to do differently. The studies in Section 2 do. Treat any AI or change statistic the same way: ask where it came from, what was measured, and who measured it.
4. Framework and original analysis
4.1 The theoretical framework
This paper combines three established models.
Why individuals adopt: UTAUT. The Unified Theory of Acceptance and Use of Technology (Venkatesh et al., 2003) merged eight earlier models into four drivers of whether a person uses a new technology: performance expectancy (will it help me?), effort expectancy (is it easy?), social influence (do people who matter to me expect it?) and facilitating conditions (do I have the access, rules and support?). In its validation, UTAUT explained about 70% of the variance in people's intention to use a technology. Humlum and Vestergaard's findings map cleanly onto it: restrictions are a facilitating-conditions problem, and training needs are an effort-expectancy problem.
How adoption spreads: the Bass diffusion model. Bass (1969) models adoption as two forces: people who adopt because of outside push (the coefficient of innovation, p) and people who adopt because others around them already have (the coefficient of imitation, q). A meta-analysis of 213 applications found average values of about 0.03 and 0.38 per year, with imitation far stronger than outside push on average (Sultan, Farley & Lehmann, 1990). Inside a company, training and leadership push act on p, and peer champions act on q.
What each adopter gains: the jagged frontier. From Dell'Acqua et al. (2023) and Brynjolfsson, Li and Raymond (2025): time saved on tasks inside the frontier, extra errors on tasks outside it, and a learning period before full benefit.
A fourth, adjacent idea informs the playbook: Edmondson's (1999) study of 51 manufacturing teams found that psychological safety, a shared belief that it's safe to take interpersonal risks, was associated with team learning behaviour, which in turn predicted performance. It was not a study of AI, so it is used here as a reasonable analogy for why people need permission to experiment and to report AI mistakes.
4.2 Methods note
The simulation models a team over 24 months. Each month, a share of non-users adopts according to the Bass equation. Each adopter's net effect on team time is the time saved on inside-frontier tasks (growing as they learn), minus rework from using AI unchecked on outside-frontier tasks, minus a short learning dip. Program costs, such as hours spent in training, are subtracted from the whole team.
Task-level inputs were drawn at random for each of 10,000 runs from ranges anchored in the studies above: share of work inside the frontier 15–35%; time saved on those tasks 14–30% (spanning the 15% field estimate and the 25.1% experimental estimate); share of work where AI is tried outside the frontier 5–15%; extra error rate there 10–25% (around the 19-point experimental estimate); rework cost 0.5 to 1.5 times the task's time; and a learning dip of 0–5% in an adopter's first two months.
Four strategies were compared. Their parameters are assumptions, not measured values, and each was varied by about ±30% across runs:
- Restrict and wait: slow diffusion (p = 0.03, q = 0.30), slow learning, high unchecked misuse.
- Install and announce: licences and an email (p = 0.10, q = 0.60), slow learning, high unchecked misuse.
- Train only: one day of training per person (p = 0.30, q = 0.80), faster learning, moderate misuse.
- Full change program: the same training, plus champions and coaching costing 1% of team time for six months, a task-by-task frontier map and verification rules (p = 0.30, q = 1.50, faster learning, low misuse).
The code is short and is available on request; a downloadable version will be added for members.
4.3 Results
All results below are model outputs. They show what follows from the assumptions and the evidence-based ranges, not what will happen in any particular organization.
| Strategy | Adoption at 12 months | Adoption at 24 months | Monthly time saved at 24 months | Total hours saved per worker over 24 months (10th–90th percentile) |
|---|---|---|---|---|
| Restrict and wait | 3% | 8% | 0.2% | 3 (1–6) |
| Install and announce | 13% | 30% | 0.8% | 11 (3–23) |
| Train only | 35% | 70% | 2.7% | 37 (12–74) |
| Full change program | 45% | 86% | 3.8% | 46 (16–92) |
Finding 1: The full program wins, eventually. It saved more total hours than install-and-announce in 99.1% of runs. For a 100-person team, the median difference is about 3,500 hours over two years.
Finding 2: It looks worst first. The full program's cumulative balance was about 16.5 hours per worker in the red at month six and still 7 hours behind at month twelve. It overtook install-and-announce at a median of month 16 (10th to 90th percentile: months 13 to 20). This is the J-curve from Section 2.4, reproduced at team scale: the costs are paid up front and the gains compound as more people adopt and get better at using the tool.
Finding 3: Spread matters more than anything else. Starting from install-and-announce and switching on one element of the full program at a time, faster adoption (training plus champions) added about 27 hours per worker over two years. Faster learning added about 5, and cutting unchecked misuse added about 3.
Calibration check. As a sanity check rather than a validation, the trained strategies land at 1.0% to 1.4% time saved at month 12 and 2.7% to 3.8% at month 24, close to the 1.4% to 2.8% averages observed in the surveys. The install-only strategy lands below that range. That fits the Danish setting, where most employers encouraged use and training was common.
5. Counter-evidence and limitations
- The rollout parameters are assumptions. No published study has measured Bass coefficients for workplace AI. Different values would change the size of every gap and the crossover month. The direction of the main results held across the ±30% variation tested, but that is not proof.
- Quality isn't fully captured. The model counts errors as rework time. Errors that reach a customer or a decision can cost far more, which would make misuse controls more valuable than the 3-hour estimate suggests.
- Self-reported time savings are weak evidence. The 1.4% and 2.8% figures come from what workers say. Surveys can't confirm the time was actually saved.
- The best studies are narrow. One firm's support agents, one consulting firm's staff, one country's labour market. Effects in other settings may differ.
- The tools keep improving. Studies from 2023 and 2024 used earlier models. The frontier moves, which is a reason to repeat the mapping exercise, not to skip it.
- Macro estimates are sobering. Acemoglu's (2025) model suggests the economy-wide gain may be small regardless of how well individual firms manage rollouts.
6. The playbook: a 90-day AI rollout built on the evidence
Each step below is tied to the driver it targets. This is analysis based on the research, not a tested program.
Days 0–15: Grant permission and set rules (facilitating conditions)
- Say clearly which tools are approved and what data may go into them. Restrictions were one of the top two barriers in the Danish data.
- Write a one-page use policy covering confidential data, verification and how to report a bad output.
- Decide what you will measure before you start (see Day 90).
Days 15–30: Map the frontier (performance expectancy, misuse control)
- List the team's 20 most common tasks. For each, run a small test: is AI output good, mixed or misleading?
- Mark each task green (use freely), yellow (use, then check) or red (don't use yet). Revisit the map every quarter as tools change.
Days 30–60: Train on real work (effort expectancy)
- Train on the team's own green and yellow tasks, not generic prompt tips. The Danish workers who didn't use AI often said they needed training.
- Start with newer staff, where the field evidence shows the largest gains, while making sure experienced staff also check quality.
Days 30–90: Build peer spread (social influence)
- Pick internal champions, for example one per eight to ten people. Give them a small amount of protected time to help colleagues and share what works.
- Have managers use the tools visibly and talk openly about AI mistakes, so reporting a bad output feels safe.
Day 90 and after: Measure the right things, and wait for the curve
- Leading indicators (watch from month one): share of the team using AI weekly; share of green tasks where AI is actually used; verification on yellow tasks.
- Lagging indicators (judge from month 12 onward): time saved, rework rate, customer or quality measures.
- Agree in advance that the program will not be judged on hours saved before month 12. In the simulation, the best strategy was still behind at that point.
7. Quick readiness check
Score each statement 0 (no), 1 (partly) or 2 (yes). Each pair maps to one UTAUT driver.
- People know which AI tools they're allowed to use. (Facilitating conditions)
- People know what data they may and may not put into them. (Facilitating conditions)
- We have tested AI on our own most common tasks. (Performance expectancy)
- We know which tasks AI gets wrong. (Performance expectancy)
- Staff have had training on their actual tasks. (Effort expectancy)
- Someone on the team can help when a person gets stuck. (Effort expectancy)
- Managers use AI themselves and say so. (Social influence)
- Reporting an AI mistake is treated as useful, not embarrassing. (Social influence)
- We measure weekly use, not just licences issued. (Measurement)
- We've agreed when we'll judge results, and it's at least a year out. (Measurement)
16–20: ready to scale. 10–15: fix the lowest-scoring pair first. Under 10: you have an installation, not an adoption.
8. Evidence-based recommendation
Treat an AI rollout as a change in how people work, not a software deployment. The evidence points to adoption as the bottleneck, and to permission and training as the barriers management controls. Spend first on spreading use (training on real tasks and peer champions), then on mapping where AI misleads, and set expectations that results will look worse before they look better. On the evidence available, that combination offers the best odds, though it will not by itself produce the dramatic gains often promised.
What would change this view
- A rigorous study showing install-only rollouts reach the same adoption and value as supported ones within a year.
- Measured, not self-reported, data showing AI gains appear immediately with no early dip.
- Evidence that newer AI tools no longer have a meaningful outside-the-frontier error penalty.
- Field estimates of workplace diffusion rates well outside the ranges assumed here.
Frequently asked questions
Why do most AI rollouts fail to deliver?
The evidence suggests the main problem is adoption, not the technology. Workers who don't use AI most often cite employer restrictions and a need for training, and average reported time savings are currently around 1.4% to 2.8% of work hours.
Is it true that 70% of change initiatives fail?
No reliable evidence supports that figure. A 2011 peer-reviewed review of five published sources found no valid empirical basis for it.
How long does it take to see a return on AI adoption?
Research on general-purpose technologies shows productivity often dips before it rises. In this paper's simulation, the strongest rollout strategy did not overtake a basic rollout until around month 16. Treat that as illustrative, not a forecast.
What is the jagged technological frontier?
It is the uneven boundary between tasks AI does well and tasks it gets wrong. In a study of 758 BCG consultants, AI improved speed and quality inside the frontier but made people 19 percentage points less likely to be correct on a task outside it.
What is the single most important part of an AI change program?
In our simulation, spreading adoption through training on real tasks and peer champions mattered far more than any other lever. Measure weekly active use, not licences.
Related reading on Stratistack
- The Control Gap: What the 2026 Evidence Says About AI Risk
- Five Tech Failures, One Pattern: Why Projects Break at the Handoff
References
[PR] = peer-reviewed. [WP] = working or discussion paper. [AO] = abstract only read.
- Acemoglu, D. (2025). The simple macroeconomics of AI. Economic Policy, 40(121), 13–58. [PR] [AO]
- Bass, F. M. (1969). A new product growth for model consumer durables. Management Science, 15(5), 215–227. https://doi.org/10.1287/mnsc.15.5.215 [PR] [Cited for the model's structure only]
- Bick, A., Blandin, A., & Deming, D. J. (2024). The rapid adoption of generative AI (NBER Working Paper No. 32966). National Bureau of Economic Research. https://doi.org/10.3386/w32966 [WP] [AO]
- Brynjolfsson, E., Li, D., & Raymond, L. (2025). Generative AI at work. The Quarterly Journal of Economics, 889–942. https://doi.org/10.1093/qje/qjae044 [PR] [AO]
- Brynjolfsson, E., Rock, D., & Syverson, C. (2021). The productivity J-curve: How intangibles complement general purpose technologies. American Economic Journal: Macroeconomics, 13(1), 333–372. https://doi.org/10.1257/mac.20180386 [PR] [AO]
- Dell'Acqua, F., McFowland, E., III, Mollick, E. R., Lifshitz-Assaf, H., Kellogg, K., Rajendran, S., Krayer, L., Candelon, F., & Lakhani, K. R. (2023). Navigating the jagged technological frontier: Field experimental evidence of the effects of AI on knowledge worker productivity and quality (Harvard Business School Working Paper No. 24-013). [WP] [AO]
- Edmondson, A. (1999). Psychological safety and learning behavior in work teams. Administrative Science Quarterly, 44(2), 350–383. https://doi.org/10.2307/2666999 [PR] [AO]
- Hughes, M. (2011). Do 70 per cent of all organizational change initiatives really fail? Journal of Change Management, 11(4), 451–464. https://doi.org/10.1080/14697017.2011.630506 [PR] [AO]
- Humlum, A., & Vestergaard, E. (2024). The adoption of ChatGPT (IZA Discussion Paper No. 16992). IZA Institute of Labor Economics. [WP] [AO]
- Humlum, A., & Vestergaard, E. (2025a). The unequal adoption of ChatGPT exacerbates existing inequalities among workers. Proceedings of the National Academy of Sciences, e2414972121. https://doi.org/10.1073/pnas.2414972121 [PR] [AO]
- Humlum, A., & Vestergaard, E. (2025b). Large language models, small labor market effects (BFI Working Paper No. 2025-56). Becker Friedman Institute, University of Chicago. [WP] [AO]
- Sultan, F., Farley, J. U., & Lehmann, D. R. (1990). A meta-analysis of applications of diffusion models. Journal of Marketing Research, 27, 70–77. [PR] [AO]
- Venkatesh, V., Morris, M. G., Davis, G. B., & Davis, F. D. (2003). User acceptance of information technology: Toward a unified view. MIS Quarterly, 27(3), 425–478. https://doi.org/10.2307/30036540 [PR] [AO]
Get the next evidence check in your inbox. Stratistack publishes one research-backed analysis a week on AI, technology and strategy. Subscribe for free and get each new paper when it goes live.